The purpose of this analysis is to create a metrics that represents the relative risk of a member across all lines of business.
Currently the quality department have access to the risk score for Medicare and Marketplace members calculated based on the CMS and HHS guidelines, but not the Medicaid risk score due to a couple reasons. The major one is that CMS only provided a suggestion on the calculation of Medicaid risk scores, and states, based on their understanding and utilization of funding, created their own standards.
There are a few other metrics that are available to access the risk of members.
-
One is the Milliman Advanced Risk Adjusters, the so-called MARA risk scores, created by Milliman and reported in MedInsight data. Several concerns emerges when the MARA risk scores are considered for risk assessment. First, they are calculated by Milliman with their proprietary algorithms, so Molina has no insights into the input elements and no way of validating the outputs. Second, there are several flavors of MARA, i.e. the concurrent and prospective, with the concurrent ones focusing on the current known status, and the prospective ones predicting the future propensity of healthcare risk. There are also a few subgroups of MARA besides of the total risk, specific for instances such as medication, inpatient/outpatient, physician and ER visits. These means that some feature engineering/selection is necessary depending on the scenario or use case.
-
Another measurement is called the “utilization index” created by quality department. The utilization index is the average of three elements from last 12 months: the percentile of unique claim counts, the percentile of average diagnosis codes per claim, and the percentile of total amount paid. The utilization index tries to take the complexity of the condition into consideration since the number of claims and the diagnoses of claims are related to the number of services a member requests, and existing conditions of the member. It may not be comparable across LOB since the payment is also dependent on the contract terms and state regulations.
The solution proposed here is to:
-
Use Medicare and Marketplace population as the training sample and testing sample.
-
Consider the risk score from CMS and HHS as the “gold standard”.
-
Develop an algorithm that predicts risk score based on MARA, utilization index, and other demographic factors, such as age, gender, and ethnicity.
-
Apply the same algorithm to all LOB, especially the Medicaid population, and calculate a universal metric that reflects the relative risk of the members.
Some thoughts:
-
What kind of risk are we talking about here? A member’s medical risk, such as the existing chronic conditions, complications, and ER usage, can be different from his/her utilization risk. It is common that high medical risk is correlated with high utilization risk, but a well-managed case can have high medical risk but low utilization.
-
The assumption of CMS/HHS risk scores being the “gold standard” is questionable. Though they are based on clinical guidelines and government regulations, there were observations/reports in the fields that these risk score constantly over/underestimated the medical risk.
-
The Medicaid population can be quite different from the Medicare and Marketplace population (maybe more similar to Marketplace, but definitely not so much to Medicare). The accuracy of the algorithm can be crippled when the algorithm was developed based on Marketplace and Medicare population without Medicaid samples, but applied to Medicaid members directly.
Results:
-
Using data from one health plan as pilot. Check the correlation and test the regression methodology.
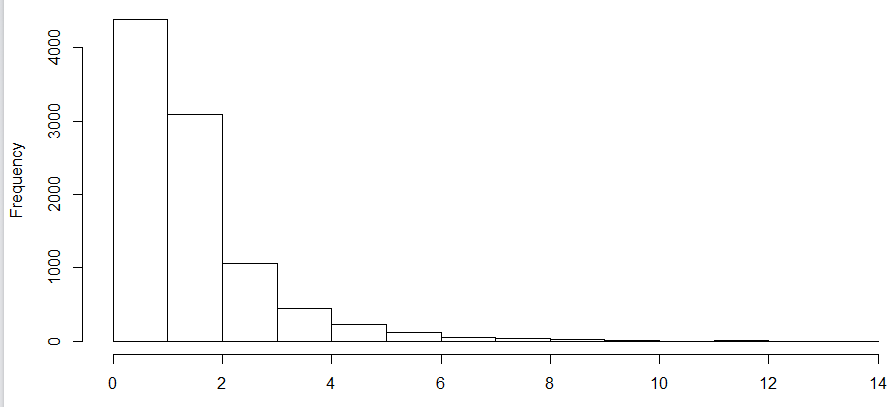
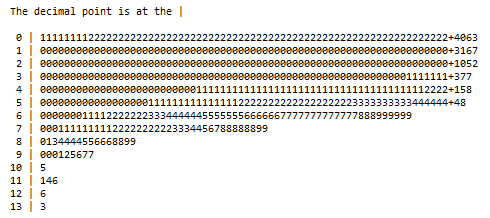
a. The distribution of Medicare risk score
b. The distribution of Marketplace risk score
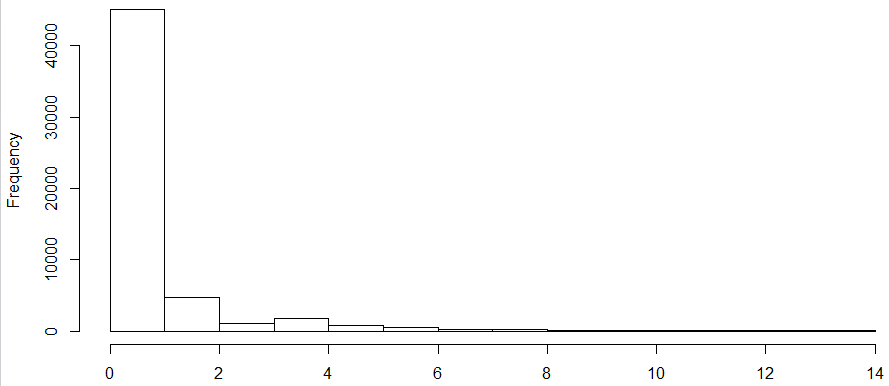
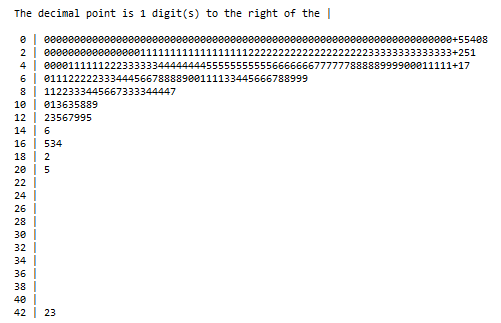
c. A couple things worth noticing in the distributions of risk scores. The distribution of both risk scores are highly right skewed in their population. The range of Medicare risk score is [0, 14], while that of Marketplace is 0 to over 400. The Medicare scores are less concentrated on the lower end than the Marketplace ones, indicating a sicker population if these two are comparable or on the same scale.
d. Normalization of the risk scores were performed to make them comparable. First took the log transformation, then cut into 2% percentiles within the population (breaks were not unique when cut in percentiles due to the skewness). The normalized risk scores had a few merits: 1. they were comparable across LOB. A 30 in Medicare meant 30% Medicare population had lower risk than that member, which meant the same in Marketplaces, though we could not say that a 30 in Medicare was as severe as a 30 in Marketplace because the normalization was specific to population; 2. the relative ranking of severity did not change after the normalization. Members with higher risk score remained in high percentile while the low remained low.
e. The correlation tests showed that Marketplace risk scores were highly correlated with MARA total risk or IP and medical risk (r-squre > 0.75), not so much with the utilization index (r-squre = 0.24), while in Medicare, the number was around 0.5 and 0.4, respectively. The risk score percentile was related closest to MARA total risk among all MARA types (r-squre = 0.34 in Marketplace, and 0.45 in Medicare), and ~0.46 with the utilization index. The prospective MARA did not perform as good as the concurrent ones.
f. Compared linear regression and random forests models using age, gender, ethnicity, utilization index, and MARA total risk as independent variables, and normalized risk score percentiles as dependent variable. Ethnicity was tested as not significantly associated with the outcome, thus discarded in the final model. Random forest outperformed linear regression in terms of prediction accuracy. The correlation between risk score percentile and predictions generated from the random forest models was close to 80%.
A couple thoughts at this point:
-
The distribution of MARA was not helpful. It ranged from 0 to over 200, right skewed, and heavily concentrated on the low end with lots of zeros.
-
Within each LOB, the absolute risk score may be a good choice for dependent variable, but when several LOB combined, the normalized risk score percentile was the only option.
-
It wasn’t surprising seeing that MARA total, IP, or medical risks were correlated with the risk scores, since these were the focus of the risk score components. It was interesting that the utilization index behaved poorly in Marketplace, while not so bad in Medicare (not sure why).
-
The random forest performed better than linear regression. The implementation of the results, however, can be tricky since the logic for the selected tree had to be exported if we wanted consistent results and scalable operations.
-
Overall the results were encouraging, so I presented to the Actuarial department for further validation and suggestion. It turned out that they were in the process of calculating risk scores following the CDPS guideline and state regulations. It seemed futile at that point of calculating imputed risk scores for Medicaid when there was an “official” one. The plan was then changed to wait for Actuarial to finish the computation and I would do a quality check on the CDPS risk scores.
The Actuarial Department has then supplied the SC Medicaid CDPS risk score for pilot and quality check. Here were the procedures and findings:
-
There were significant portion of mismatch on members from both sources. There were 10305 lines in the file quality created (one member per line without duplicates after removing MMP), and 96317 lines in the file actuarial prepared (also one member per line with no duplicates). Only 78008 members were found in both files, with 25497 only in the file from quality, and 18309 only in the file from actuarial. Both files were supposed to capture 2017 data. Possible explanation of the discrepancy is the inclusion/exclusion criteria. While details were needed from quality, the actuarial mentioned that
a. Data pulled from Medinsight data
b. Snapshot of members enrolled as of 12/2017 taken
c. 2017 medical and Rx claims were pulled (from Medinsight) with a paidthru date of 1/31/2018
-
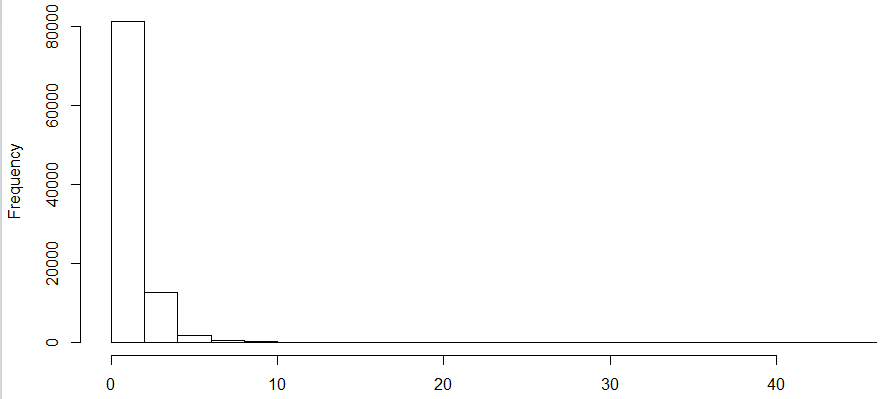
The distribution of the risk score (shown below) was extremely skewed with a wide range, even more than those observed in Medicare or Marketplace.

-
The quality provided the exact numbers on the elements of the utilization index. It turned out that the paid_ntile is a better indicator since it had a higher correlation coefficient with MARA and CDPS risk score than the utilization index.
-
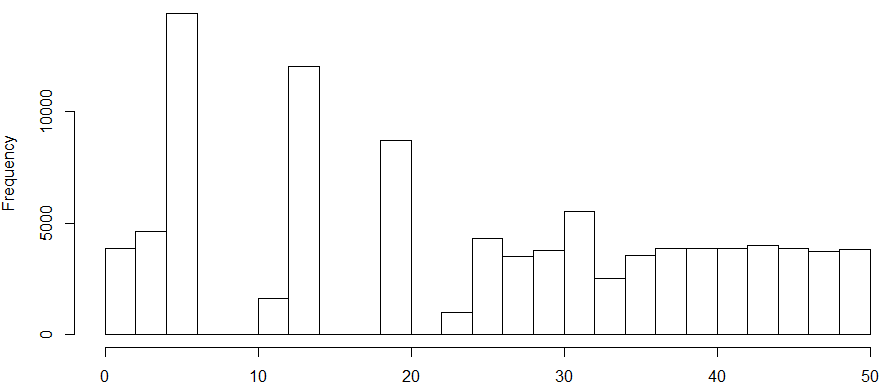
The result of the normalization of the risk score was not ideal due to heavy concentration, and there was breakage on the distribution. The percentile breaks were not unique.
-
The correlation between the prediction from linear regression or random forests and risk score or normalized risk score was no higher than 67%.
-
If the model developed from Marketplace and Medicare was applied to Medicaid population, the accuracy was ~ 40%.
Some thoughts at this point:
-
Some quality check is needed on both quality and actuarial sides to figure out the member mismatch issue. Some validation on the methodology of actuarial would be good.
-
There are substantial differences in the three populations (Medicaid, Medicare, and Marketplace) in terms of population risk and risk composition. Models should be population specific.
-
If there is indeed some portions missing/blanks of the risk scores, statistical methods can be used to calculate imputed risk scores based on the rest of the same population.
-
It was mentioned that the government risk scores may not be great for risk assessment. A better measurement is needed, but a lack of “gold standard”, or objective outcome is the blocker here.
-
If we decide that the CMS/HHS risk scores are not “gold standard” for risk assessment, and we only want to use them as a component of a new risk assessment metric along with other factors like age, gender, MARA, and utilization. This may become an unsupervised machine learning problem.